First login & dashboard
The first thing you'll see after signing in is your Dashboard — a one-page overview of your church.
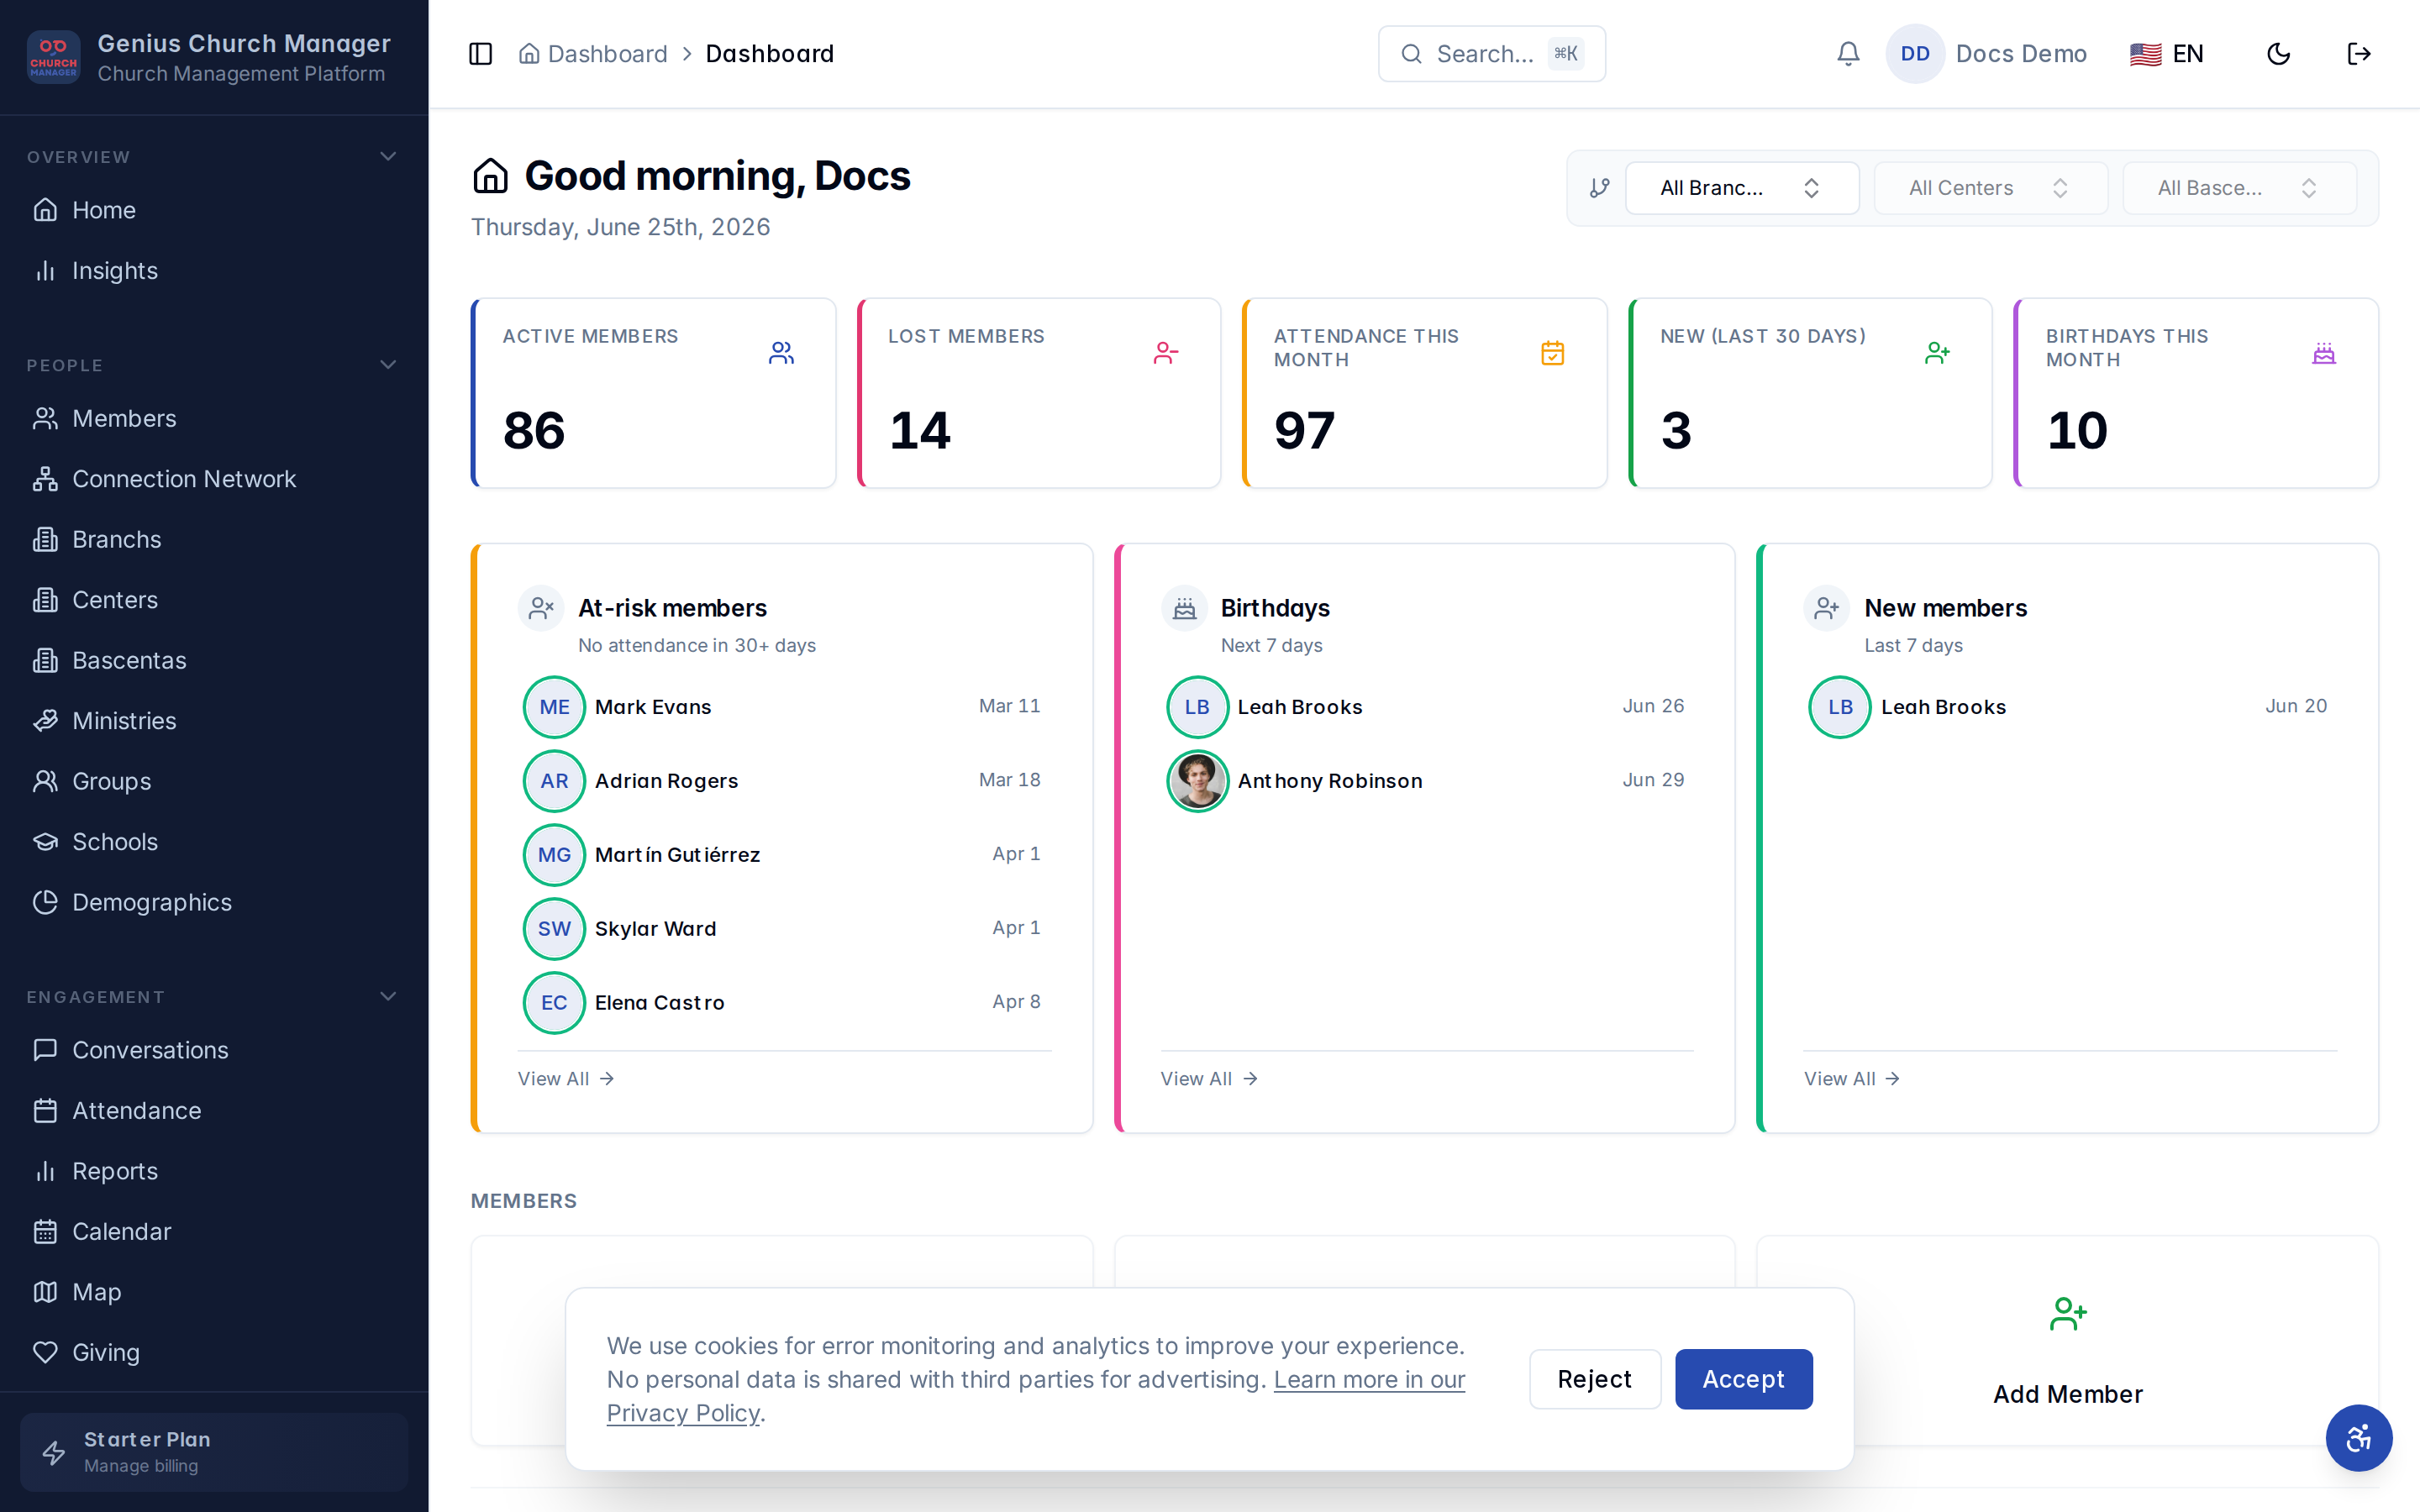
The four areas
1. KPI tiles (top row)
At-a-glance numbers for the things you check daily:
- Active members — total members in your church, excluding ones marked lost.
- Lost members — members flagged as no longer attending. Tap to see the backsliding members list.
- Recent signups — new members added in the last 30 days.
- Birthdays this week — heads-up for pastoral care.
2. Charts (middle)
- Member growth — your active member count over the last 24 weeks. A flat line is worth investigating.
- Attendance trends — average attendance per service, smoothed over the same period.
- Active vs lost — donut showing the split. Healthy churches sit around 85/15.
3. Module tiles (bottom)
Big clickable cards for the modules you have permission to use:
- Members
- Attendance
- Giving
- Messaging
- Workflows
- Reports
What you see depends on your role and your church's plan. Some modules (PowerSync offline mode, advanced workflows) require Growth or higher.
4. Sidebar (left)
Same modules as the dashboard tiles, plus settings. The sidebar is always available — click your church name at the top to switch between churches if you have access to more than one.
Switching to Spanish
Click the language switcher in the top-right corner. Your choice is saved in your browser, so you'll come back to Spanish on every reload. The switcher detects your browser's language on first visit and defaults to that — Spanish browsers see Spanish on day one without any clicks.
What to do next
The next setup step is to invite your team so you're not the only person in the workspace.